 Dale Shelabarger

Rising costs and volatile demand make menu and inventory decisions increasingly difficult for restaurants. ABC/XYZ analysis provides a structured way to identify which dishes contribute most to the business and how predictable their demand is.
What is ABC/XYZ analysis in restaurants?
ABC/XYZ analysis combines item value with demand predictability. ABC classifications show which dishes contribute most to sales, revenue or profit, while XYZ classifications indicate whether demand is stable, variable or difficult to forecast. Restaurants can use the combined results to improve menu decisions, purchasing and stock control.
ABC and XYZ Analysis at a Glance
| Method | What it measures | Typical use |
|---|---|---|
| ABC analysis | Item importance or financial contribution | Menu profitability and prioritisation |
| XYZ analysis | Demand variability and predictability | Forecasting and stock planning |
| ABC/XYZ analysis | Value and predictability together | Menu, purchasing and inventory decisions |
What Is ABC Analysis?
ABC analysis categorises products according to their importance to the business. It is often associated with the Pareto principle, which suggests that a relatively small proportion of items may account for a large share of business value.
In restaurant menu analysis, items can be classified separately by measures such as sales volume, revenue and profit. An item rated AAA performs strongly across all three measures, while a CCC item performs poorly across each one.
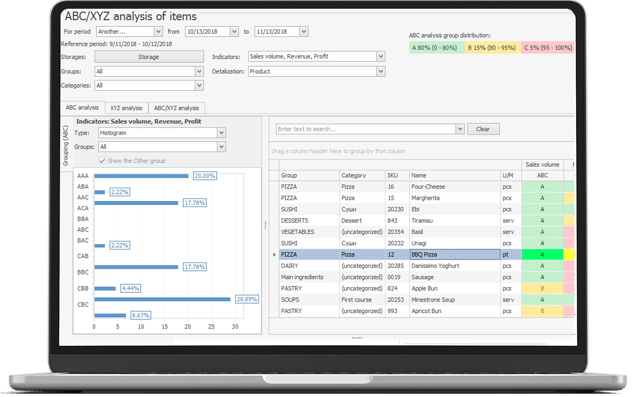
Combined classifications provide a more detailed view than a single score. For example, an AAB item may generate strong sales and revenue but weaker profit, suggesting that recipe cost or pricing should be reviewed.
A BAA item may sell less frequently but still generate strong revenue and profit when ordered. In this case, better menu placement, staff recommendations or targeted promotion may help improve visibility.
ABC analysis can therefore support menu optimisation, purchasing priorities and more focused stock management.
What Is XYZ Analysis?
XYZ analysis groups menu items according to the consistency of their demand. X items have relatively stable demand, Y items show moderate variation and Z items are the least predictable.
The coefficient of variation is commonly used to measure this variability. The exact thresholds assigned to X, Y and Z categories can differ between systems and should therefore be interpreted according to the methodology being used.
Coefficient of variation = standard deviation ÷ average demand × 100
X items are generally easier to forecast and replenish consistently. Y items require closer monitoring because demand varies more. Z items are the hardest to predict and may need more cautious purchasing, depending on supplier lead times and shelf life.
When applied carefully, XYZ analysis can help reduce overstocking, prevent stockouts and improve supplier planning.
How ABC and XYZ Analysis Work Together
ABC analysis explains how important an item is to the business, while XYZ analysis shows how predictable its demand is. Combining both provides a clearer basis for action.
| Example classification | Meaning | Possible response |
|---|---|---|
| AAA/X | High-performing item with stable demand | Maintain availability and visibility |
| AAB/Y | Strong sales and revenue but weaker profit, with variable demand | Review recipe cost and pricing |
| BAA/X | Lower sales but high revenue and profit, with stable demand | Improve menu placement or promotion |
| CCC/Z | Weak performance and unpredictable demand | Consider removing or replacing |
Why ABC/XYZ Analysis Is Often Overlooked
ABC/XYZ analysis can be difficult to maintain manually because it depends on accurate sales, cost, inventory and demand data. Spreadsheet-based analysis also requires time and a clear understanding of the classification method.
Many restaurant POS systems do not include built-in ABC/XYZ functionality, which means operators may need to combine data from several sources before they can classify menu items reliably.
How Syrve Applies ABC/XYZ Analysis
Syrve brings the required data together within one restaurant management platform, reducing much of the manual work involved in ABC/XYZ analysis.
Data Collection
Syrve collects sales data from the front-of-house POS as orders are processed. Inventory levels, stock movements and supplier purchases can also be monitored in real time.
.png?width=636&height=274&name=abc-xyz3(1).png)
ABC Categorisation
Using POS and cost data, Syrve classifies menu items according to measures such as consumption rate and profit contribution.
XYZ Categorisation
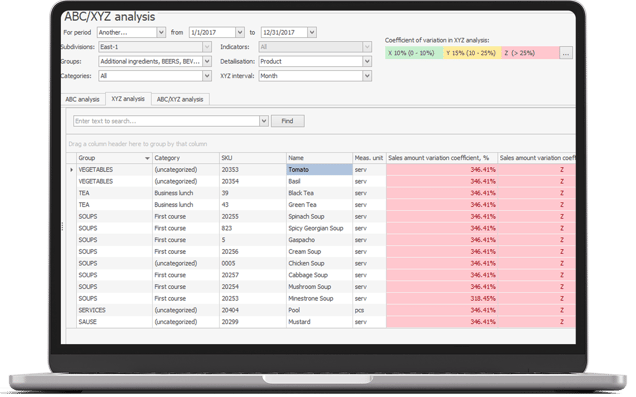
Historical sales data is analysed to assess the variability and predictability of demand for each item. Forecasting data can then support future purchasing and stock planning.
ABC/XYZ Reporting
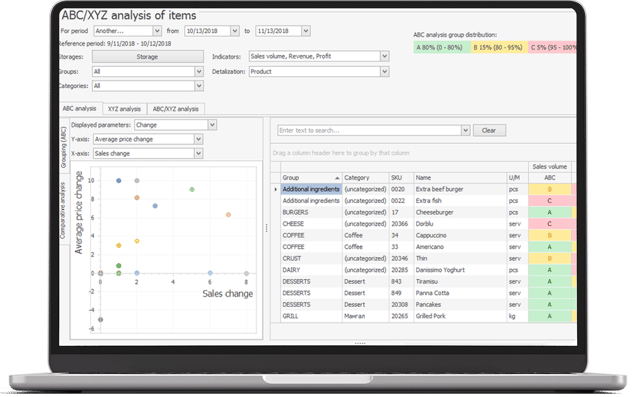
ABC/XYZ classifications are available through Syrve’s reporting interface, allowing operators to review individual items, grouped classifications and visual summaries without relying on formula-heavy spreadsheets.
This extends to chains to multi-site estates as well, with operators able to instantly analyse menu items and classify dishes across multiple sites.
Menu Analysis and Recommendations
Syrve can recommend actions such as reducing cost, stimulating sales or removing an item from the menu, based on the available ABC/XYZ data.
This also extends to intelligent notifications. Powered by AI, Syrve notifies you whenever specific menu items need attention so there's no need to manually generate and interpret ABC/XYZ reports. Th systems effectively converts raw data into real-time guidance allowing managers to make precise data-driven decisions.
Benefits of ABC/XYZ Analysis for Restaurants
ABC/XYZ analysis can support better decisions across menu design, stock control and purchasing.
A More Profitable Menu
Operators can identify strong performers, underperforming dishes and items that require pricing or recipe adjustments. High-value dishes can be promoted more prominently, while weak items can be reviewed or removed.
Better Stock Planning
Demand classifications help operators distinguish between stable and unpredictable items, allowing stock levels to be planned more carefully.
Lower Inventory Costs
Removing low-value items and improving purchasing around demand can reduce unnecessary ingredient holdings and lower the risk of waste.
Improved Availability
More accurate demand insight can help restaurants maintain availability of popular, high-value dishes without carrying excessive stock.
Improve Menu and Inventory Decisions With Syrve
ABC/XYZ analysis gives restaurants a clearer view of item value and demand predictability. When supported by reliable data, it can improve menu decisions, purchasing and stock control.
Learn more about Syrve’s menu management software.
Frequently Asked Questions
What is ABC/XYZ analysis?
ABC/XYZ analysis combines item value with demand predictability. ABC classifications show business importance, while XYZ classifications show how stable or variable demand is.
What is the difference between ABC and XYZ analysis?
ABC analysis focuses on the value or importance of an item. XYZ analysis focuses on the consistency and predictability of demand.
How is ABC analysis used in restaurants?
Restaurants can classify dishes by sales volume, revenue, profit or another chosen measure. The results can then guide menu placement, pricing, purchasing and stock priorities.
How is XYZ demand variability calculated?
XYZ analysis commonly uses the coefficient of variation, calculated by dividing standard deviation by average demand and multiplying by 100.
What does an AAA classification mean?
In a multi-measure restaurant model, AAA indicates that an item performs strongly across all three selected ABC measures, such as sales volume, revenue and profit.
How can ABC/XYZ analysis reduce food waste?
It can reduce waste by helping operators identify low-value items, plan stock around demand predictability and avoid purchasing excessive quantities of unpredictable products.
Is ABC/XYZ analysis the same as menu engineering?
No. Menu engineering usually compares item popularity and contribution margin. ABC/XYZ analysis can use several value measures and also includes demand variability.
What data is needed for ABC/XYZ analysis?
Restaurants typically need reliable sales, revenue, profit, recipe cost, stock movement and historical demand data.