
 Dale Shelabarger

“Razor-thin”. An oft-repeated expression in restaurant operator parlance. These days, it’s rarely mentioned in reference to prosciutto prep or some other delicate culinary procedure. No. More often than not, it’s attached to the uncomfortable subject of profit margins.
And for good reason. Because in hospitality, high revenue doesn’t always translate into high profitability. Restaurants operate in an industry with notoriously tight margins.
In 2026, operators face financial pressure from multiple directions. Ingredient prices are soaring as consumer budgets get tighter, while labour costs continue to rise amid persistent staff shortages.
At the same time, fierce competition and changing consumer habits are forcing restaurants to adapt to growing demand for delivery and convenience-led dining experiences.
Profit margins have therefore become a survival metric — a kind of economic bellwether that reveals just how resilient a restaurant business truly is under pressure.
So, with profitability now under greater scrutiny than ever, we’ve put together a comprehensive guide to the finer points of restaurant profit margin. Among other things, it explores the factors placing the greatest pressure on restaurant operators in 2026 and the practical strategies that can be used to strengthen margins going forward.
To begin with the basics.
What Are Restaurant Profit Margins?
Put simply, restaurant profit margins indicate how much revenue a restaurant retains after accounting for its costs and expenses. While revenue refers to the total amount of money generated through sales, profit is what remains after expenses such as ingredients, labour, rent and utilities have been deducted.
In addition, operators have to contend with equipment maintenance, delivery platform fees, occupancy costs, insurance and a range of additional overheads.
Once these expenses are accounted for, the remaining profit is often far smaller than many people assume. So, a venue generating millions in annual turnover may still struggle with profitability if operating costs are too high.
This is why profit margins are far more revealing than topline sales alone. Unfortunately, the allure of total revenue causes many operators to overlook the underlying economics that determine whether a business is actually healthy. And the consequences are fairly predictable.
But if revenue alone doesn't determine financial success, how do restaurant operators accurately measure profitability?
Gross Profit vs Net Profit
Central to any assessment of restaurant profitability are gross and net profit. Although closely related, each metric measures very different elements of a restaurant’s financial performance.
Gross profit refers to the amount of revenue that remains after subtracting the direct costs of producing and serving menu items. This is commonly known as a restaurant's cost of goods sold (COGS) and includes expenses like packaging, ingredients, beverages and so forth.
Net profit on the other hand, indicates what’s left after all business expenses have been deducted. This includes labour costs, rent, utilities, equipment costs, marketing expenses, taxes and insurance.
In basic terms then, gross profit describes how profitable a restaurant’s products are. Net profit refers to how profitable the business itself is. Restaurant operators with any sense will therefore track both because they provide different operational insights.
Gross profit can help identify potential issues such as menu pricing, portion control, supplier costs and food waste. Net profit will reveal broader operational problems such as labour inefficiency, poor cost control or excessive overheads.
Understanding the relationship between gross and net profit is critical because it helps identify precisely where profitability is gained or lost.
How to Calculate Restaurant Profit Margins
Understanding restaurant profit margins begins with understanding how profitability is actually calculated. While the underlying formulas themselves are relatively straightforward, the operational insights they provide can prove invaluable for restaurant operators looking to improve financial performance.
Formula for Calculating Gross Profit
As we’ve seen, gross profit indicates the amount of revenue left after subtracting the direct costs associated with producing and serving food or drink, also known as cost of goods sold (COGS). This is the formula:
Gross Profit Margin (%) = [(Revenue – COGS) / Revenue] × 100
Example: So if a restaurant generates £100,000 in monthly revenue but in that same period spends £35,000, the formula would be:
(£100,000 - £35,000) / £100,000
£65,000 / £100,000 = 0.65 x 100
Gross Profit Margin = 65%
This means the restaurant retains 65p of gross profit for every £1 generated in revenue, before operational expenses such as labour, rent and utilities are deducted.
Formula for Calculating Net Profit
Net profit measures the amount of money a restaurant retains after all expenses have been deducted from total revenue. So the formula is:
Net Profit Margin (%) = (Net Profit ÷ Revenue) × 100
Example: If a restaurant generates £100,000 in monthly revenue but also incurs
£35,000 in COGS
£28,000 in labour costs
£18,000 in rent and utilities
£12,000 in additional operating expenses
Total expenses = £93,000
So if we apply the formula:
£100,000 – £93,000 = (£7,000 / 100,000) x 100
Net Profit Margin = 7%
This means the restaurant retains 7p in profit for every £1 generated in sales after all expenses have been deducted.
Why Restaurant Margins Are So Low
Historically, restaurant profit margins have always been rather slim. And a lot of this has to do with high fixed costs such as rent, utilities, insurance, equipment leases and maintenance.
These ongoing expenses recur month after month, regardless of how busy a restaurant actually is. This means that even short periods of slow trading can really dial up the pressure.
To make matters worse, restaurant and food service operations also rely on perishable inventory. In contrast to other sectors, most unsold stock cannot simply be stored indefinitely or resold at a later date.
Once certain ingredients exceed their shelf life or expiration date, they need to be disposed of, thus becoming a direct cost to the business.
Labour costs are another major burden, particularly in 2026. The restaurant industry is extremely labour-intensive, requiring front-of-house staff, chefs, cooks, kitchen staff, cleaners and managers for any given day.
The rising costs of wages, employee benefits, training, and staff attrition continue to place huge pressure on restaurant profit margins and have only got worse in recent years.
Then there are rising occupancy and utility costs. Commercial rents together with inflation and higher energy prices only tighten the vice further. Taken together, these pressures explain why even the most successful restaurants sometimes operate with relatively modest net profit margins, in spite of high revenue.
What Is a Good Restaurant Profit Margin?
There isn’t really a universal benchmark for restaurant profitability. Profit margins vary considerably and are influenced by numerous factors including restaurant type, size and location.
In general, most restaurants operate with average net profit margins ranging between 2% and 8%. Full-service restaurants typically sit at the lower end of the spectrum due to higher labour and operational costs.
Quick-service restaurants (QSRs), cafés and delivery-focused concepts often achieve slightly higher margins because of lower staffing requirements and faster customer turnover.
.png?width=636&height=477&name=White%20Green%20Modern%20Progress%20Bar%20Graph%20(1).png)
Geography also plays a major role in restaurant profitability. Restaurants operating in major cities such as London typically face higher rents, utility costs and wages. These expenses are often lower in suburban areas or smaller towns.
Thus, experienced operators tend to treat industry averages as reference points rather than definitive indicators of financial health.
Profit Margins by Restaurant Type
Here’s a breakdown of typical profit margin ranges by restaurant type, together with the key factors that drive profitability within each niche.

Full-Service Restaurants
Although revenue is often high, full-service restaurants typically endure some of the lowest margins in the industry. Extensive labour requirements, longer service times and greater operational complexity can quickly compress profitability, particularly during quieter trading periods.
Unlike quick-service concepts, full-service restaurants rely heavily on front-of-house staffing, table service and more elaborate kitchen operations. Labour alone therefore accounts for a substantial proportion of revenue.
Larger menus and broader ingredient inventories all contribute to increased costs too, while longer table turnover times can also limit revenue potential. But full-service restaurants are not necessarily low-profit businesses.
Operators with strong branding, effective cost control and carefully engineered menus can still achieve healthy margins.
- Average gross margin: 60–70%
- Average net margin: 3–6%
Profitability Drivers:
- Labour efficiency
- Table turnover
- Menu pricing
- Occupancy costs
- Beverage sales
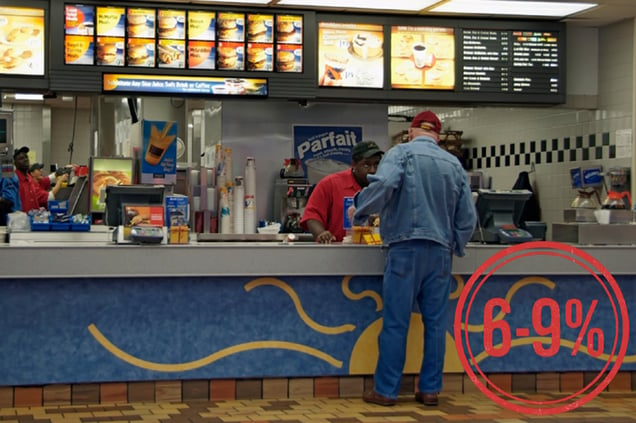
Quick-Service Restaurants (QSRs)
Quick-service restaurants tend to enjoy healthier margins. This is largely thanks to lower labour costs and simplified operations as well as higher throughput. Limited table service keeps staff expenses down while the use of smaller menus and standardised prep helps to reduce operational complexity.
Faster service is also a major factor with shorter transaction times reducing labour costs per order while at the same time enabling restaurants to process a higher volume of sales throughout the day.
With that said, stronger margins are far from guaranteed. Quick-service operators are heavily reliant on volume, meaning profitability can take a hit when footfall declines or delivery commission fees rise.
Competition is also intense, particularly in urban areas where price sensitivity is high and customer loyalty limited.
- Average gross margin: 60–75%
- Average net margin: 6–9%
Profitability drivers:
- High customer volume
- Operational efficiency
- Streamlined menus
- Automation
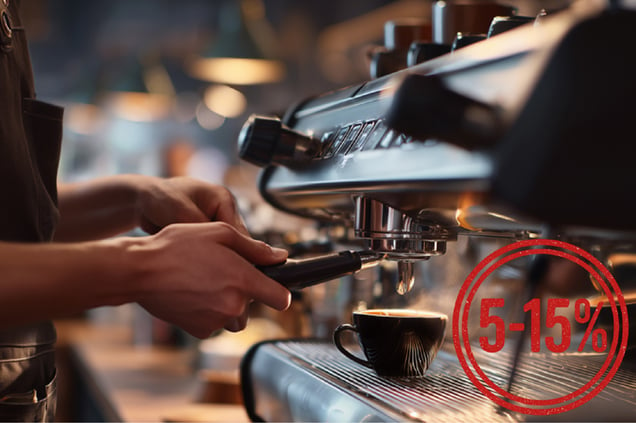
Cafés and Coffee Shops
Cafés and coffee shops often enjoy the healthiest gross margins in hospitality. This is mainly due to the strong markup potential of beverages such as specialty coffees, teas and cold drinks.
A cup of coffee that costs relatively little to produce can generate substantial profit when sold at scale, making beverage-led concepts especially attractive from a margin perspective.
However, café profitability varies considerably according to location and occupancy costs. Operators in high-footfall urban areas may benefit from strong customer volume. However, they often face elevated rent and staffing expenses which often compress net margins.
There is also increasing competition from larger chains, convenience retailers and app-based delivery platforms which places additional pressure on profitability.
- Average gross margin: 65–85%
- Average net margin: 5–15%
Profitability drivers:
- Beverage markups
- Repeat customer traffic
- Upselling pastries and light food items
- Takeaway and grab-and-go sales
- Loyalty programmes
- Low kitchen complexity
- High-volume morning trade
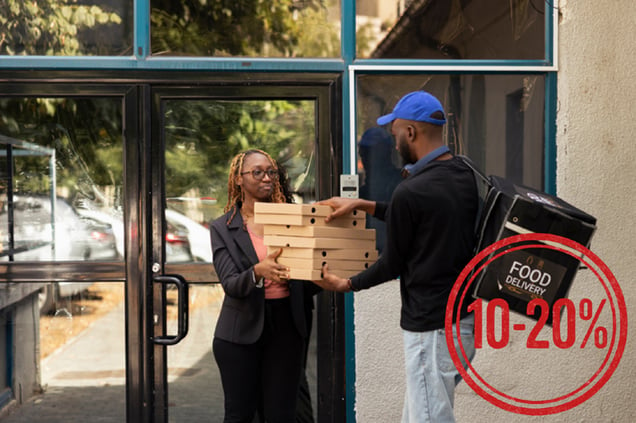
Ghost Kitchens
Ghost kitchens, also known as dark kitchens, virtual kitchens or delivery-only kitchens, have emerged as one of the most operationally lean restaurant models in modern hospitality.
Operating away from premium high-street locations and without the need for dine-in space or front-of-house staff, many of the overheads associated with traditional restaurants can be jettisoned.
However, the business model is not without challenges. A heavy reliance on third-party delivery platforms leaves operators vulnerable to high commission fees. Competition is also fierce making digital marketing, customer retention and brand visibility increasingly important and often expensive.
- Average gross margin: 70–85%
- Average net margin: 10–20%
Profitability drivers:
- Low occupancy costs
- Reduced front-of-house labour
- High delivery order volume
- Streamlined menus
- Operational efficiency
- Multi-brand kitchen models
- Data-driven ordering optimisation

Food Trucks
Food trucks are a popular hospitality model thanks to their comparatively low start-up costs and operational flexibility. Without the added expense of high commercial rents, staffing and utility bills, operators often achieve healthier margins.
However, profitability can fluctuate dramatically. Food trucks remain heavily exposed to weather conditions, seasonal demand and local permitting regulations. Limited kitchen space also restricts menu variety and order volume during peak trading periods. Fuel costs, equipment maintenance and generator expenses.
- Average gross margin: 65–75%
- Average net margin: 6–12%
Profitability drivers:
- Lower occupancy costs
- Event and festival revenue
- Streamlined menus
- Mobility and location flexibility
- Reduced staffing requirements
- High-volume service periods
- Strong social media visibility

Fine Dining
Fine dining restaurants can generate exceptionally high revenue per guest. This is usually achieved through premium pricing, curated dining experiences, and strong beverage sales.
But they also have to deal with some of the most challenging cost structures. Premium ingredient sourcing, highly trained specialist staff and elevated service expectations put considerable pressure on profitability levels, even in high-performing venues.
Maintaining consistency is also critical. Guests paying premium prices expect exceptional food, service and ambience, meaning operators often have limited flexibility when attempting to reduce costs.
In addition, fine dining restaurants can be especially vulnerable during periods of economic uncertainty, as consumers tend to reduce discretionary luxury spending when budgets tighten.
As a result, even highly acclaimed venues often operate with surprisingly narrow net profit margins despite strong turnover and high menu prices.
- Average gross margin: 65–70%
- Average net margin: 2–6%
Profitability drivers:
- Premium menu pricing
- Reservation demand
- Operational efficiency
- Strong brand reputation
- High customer spend per cover
- Private dining and events
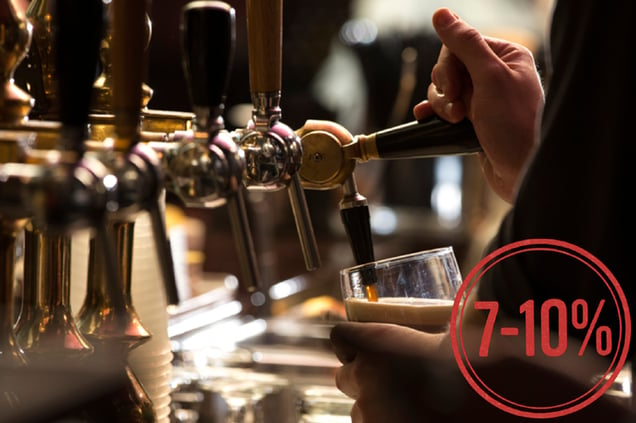
Bars and Pubs
In spite of the current pressures being endured by bars and pubs in the UK, on paper, the business model should achieve healthy profit margins.
This is mainly due to the strong markup potential of alcoholic drinks which carry much higher margins than food. Pubs often benefit from repeat local trade and event-driven revenue opportunities such as sports screenings and live music.
Yet, profitability can vary significantly and depends on a balance between food and beverage sales. For example, food-led pubs often face similar labour and inventory pressures as those faced by full-service restaurants.
Rising alcohol duties, energy costs and changing drinking habits also place huge pressure on operators, particularly independent venues competing against chains and larger hospitality groups.
- Average gross margin: 70–80%
- Average net margin: 7–10%
Profitability drivers:
- Alcoholic beverage sales
- Premium spirit and cocktail markups
- Late-night trading
- Event revenue
- Repeat local customers
- Efficient staffing models
- Upselling food alongside drinks
.png?width=712&height=474&name=food-expenses-chart3(1).png)
The Biggest Factors Affecting Restaurant Profit Margins
Restaurant profitability is influenced by a myriad of operational, economic and consumer-driven factors. Some pressures are largely outside of an operator’s control, while others stem from internal inefficiencies. Here’s a breakdown.
Food Costs & Inflation
Restaurant food costs are one of the single biggest factors that affect profitability. Because ingredients and beverage inventory represent direct operational expenses, even relatively modest increases in supplier pricing can place immediate pressure on margins.
In normal circumstances, inventory forecasting would help to alleviate this pressure. But the process is now complicated by supply chain volatility and fluctuations in the cost of meat, dairy, oils and produce.
Supplier instability in particular has become a major concern. Delays, shortages and inconsistent pricing are disrupting purchasing strategies and forcing operators to source more expensive alternatives at short notice.
At the same time, many restaurants also contend with so-called “shrinkflation” - a process by which suppliers reduce product quantities or sizes while maintaining similar pricing structures. This quietly increases food costs over time unless portion sizes, menu pricing and inventory controls are carefully monitored.
Labour Costs & Staffing Shortages
Staff-related expenses are an enormous drain on profitability in most food service verticals. They are being driven by rising minimum wages, staff turnover costs and the broader economic pressures affecting the labour market.
To survive, many operators are forced to offer higher salaries and incentives, simply to remain competitive when recruiting staff.
Retention is now a major problem. High employee turnover creates ongoing recruitment and training costs, while frequent staffing disruptions can negatively affect operational consistency, and service quality.
Scheduling inefficiencies place even further strain on profitability. Overstaffing during quieter trading periods can unnecessarily inflate labour costs - understaffing during peak service windows may reduce turnover capacity and slow service times. This has a direct impact on revenue generation.
Rent, Utilities & Energy Costs
Rent, utilities and energy bills are all financial burdens for operators, especially for those located in urban locations with high occupancy costs. Unlike certain operational expenses that fluctuate with trading activity, these costs are largely fixed overheads.
Restaurants must therefore continue paying them irrespective of trading performance or customer demand. In recent years rising energy prices have become a major concern for restaurants, where day-to-day operations depend heavily on power-intensive equipment.
Refrigeration, ovens, grills, extraction systems, dishwashers and climate control all consume significant amounts of electricity or gas – utility price inflation, particularly in the UK, makes it especially difficult for operators to absorb costs without affecting margins.
Delivery Apps & Third-Party Fees
Third-party delivery platforms have reshaped the restaurant industry over the past decade for better and for worse. On the one hand, they’ve created new revenue opportunities. But at the same time, they’ve placed additional pressure on profit margins.
On the surface, delivery apps are of enormous benefit to restaurants and food service operators. They increase visibility, expand customer reach and allow the operators to generate additional order volume without increasing physical seating capacity.
Unfortunately, all of these benefits are subject to quite a large caveat. The commission employed by the third-party delivery providers is rather high, sometimes in the region of 15–35% per order.
For restaurants already operating on thin margins, these fees can substantially reduce profitability and, in some cases, turn otherwise healthy sales volumes into relatively low-margin revenue.
Many operators also underestimate the hidden operational costs associated with delivery, with packaging, extra kitchen workload and order management systems all placing additional strain on profit margins.
It is therefore unsurprising that many operators now focus on encouraging direct online ordering to reduce platform dependency and ultimately, protect margins over the long term.
Food Waste
Food waste remains a persistent threat to restaurant profitability. Relying heavily on perishable inventory means ingredients often expire which, operationally-speaking, becomes a direct financial loss.
Inventory inefficiencies are one of the most common causes of excessive food waste. Poor forecasting, inaccurate stock tracking and inconsistent ordering practices can all result in excess purchases.
Because of this, restaurants often end up with more stock than they can realistically use. Cash flow is then tied up in unused inventory which increases the financial burden further.
Over-sized portioning also increases food costs, particularly in large high-volume operations. When multiplied across hundreds or thousands of orders, even relatively small inconsistencies can accumulate into significant inventory losses and place considerable pressure on restaurant profit margins.
Menu Complexity
Another operational misstep that’s still widely prevalent in the restaurant sector is excessive menu complexity. Expansive menus may appear attractive from a customer perspective, but they often create significant operational inefficiencies behind the scenes that can impact profitability.
One of the biggest issues is SKU creep - the gradual accumulation of ingredients, products and menu variations over time. As menus expand, restaurants frequently end up carrying a wider range of inventory, which increases purchasing costs, storage requirements and the likelihood of spoilage.
Complex menus can also create prep inefficiencies within the kitchen. Additional ingredients, recipes, and preparation methods increase operational complexity, slow service times, and place greater strain on kitchen staff, particularly during busy trading periods.
Consumer Behaviour Changes
Economic uncertainty and shifting lifestyle habits continue to reshape how, where, and why consumers spend money on dining experiences, placing additional pressure on restaurant profitability.
One of the most significant trends in recent years has been the rise of value-led dining. As household budgets tighten, consumers have become increasingly price-conscious. Much greater scrutiny is now placed on things like menu pricing, portion sizes and perceived value for money.
This has made it far more difficult for restaurants to pass rising operational costs directly onto customers without affecting demand.
Many operators have also reported reduced alcohol spending, particularly as consumers become more selective with discretionary purchases. Because alcoholic beverages typically carry some of the strongest margins in hospitality, lower drink sales can have a disproportionate impact on overall profitability.
At the same time, expectations around ‘convenience’ continue to influence customer behaviour. Diners now expect fast ordering, delivery access, mobile payments and seamless digital experiences. Restaurants unable to adapt to these expectations often struggle to remain competitive.
How to Improve Restaurant Profit Margins
Although many pressures affecting restaurant profitability are outside of an operator’s control, strong operational management can still make a significant difference. Below are some of the most effective strategies for improving restaurant profitability.
Optimise Menu Pricing
Menu pricing should reflect current operating conditions, but effective strategies rarely rely on blanket price increases. Instead, operators often make targeted adjustments based on customer demand, menu performance and contribution margins.
Use Menu Engineering
Menu engineering helps restaurants analyse dishes according to profitability and popularity. This allows operators to optimise pricing, menu design and promotional activity while identifying underperforming items that may be reducing profitability.
Reduce Food Waste
Better inventory control, forecasting and ingredient cross-utilisation can significantly reduce restaurant food waste and improve margins.
Improve Labour Efficiency
Better staff management including smarter scheduling, shift optimisation and improved workforce planning help improve restaurant staff retention and control costs without compromising service quality.
Increase Average Spend Per Guest
Strategies such as upselling, meal bundles, loyalty programmes and premium add-ons can increase transaction values and improve profitability without necessarily increasing customer traffic.
Improve Table Turnover
For dine-in restaurants, faster ordering, improved kitchen workflows and streamlined payment systems can increase table turnover and maximise revenue potential during peak trading periods.
Simplify Operations
Reducing unnecessary operational complexity often improves efficiency. Smaller menus, simplified preparation processes and streamlined workflows help reduce labour requirements, minimise waste and improve consistency.
Negotiate Supplier Costs
Restaurants can often improve margins by reviewing supplier agreements, purchasing more strategically and maintaining relationships with multiple suppliers to improve pricing flexibility.
Implement the Latest Technology
Modern restaurant management platforms provide operators with greater visibility across sales, inventory, labour and customer behaviour. When implemented effectively, technology can help reduce inefficiencies, improve forecasting and support stronger long-term profitability.
Key Restaurant Profitability KPIs
Successful restaurant operators rely on a range of KPIs to monitor operational performance. These can reveal a whole host of underlying inefficiencies, from excessive food waste and poor labour allocation to underperforming menu items and declining customer spend.
Food Cost Percentage
Food cost percentage measures how much of a restaurant’s revenue is spent on ingredients and beverage inventory. It’s actually one of the most closely monitored metrics in the restaurant industry, given how quickly rising ingredient costs and food waste can erode margins. Calculating food cost percentage requires the following formula:
Food Cost % = (COGS / Revenue) × 100
Labour Cost Percentage
Labour cost percentage tracks how much revenue is allocated to staffing expenses, including wages, salaries, benefits and payroll taxes. It has become a very important metric in recent years due to rising wage pressures, labour shortages and the growing operational costs associated with recruitment and staff retention. The formula is:
Labour Cost % = (Labour Costs / Revenue) × 100
Prime Cost Percentage
Prime cost combines a restaurant’s two largest controllable expenses: labour labour costs and cost of goods sold. Operators keep close tabs on prime cost because it provides a view of how efficiently a restaurant is functioning operationally.
The formula is:
Prime Cost % = ((Labour Costs + COGS) / Revenue) × 100
Revenue Per Seat
Revenue per seat measures how effectively a restaurant generates income relative to its seating capacity. It’s a foundational metric that allows operators to evaluate dining room efficiency, table turnover, space utilisation and service flow. Higher revenue per seat often indicates stronger operational performance.
Table Turnover
Table turnover tracks how frequently tables are occupied and reset during service periods. While faster turnover can increase revenue potential, the metric should be analysed alongside other profitability KPIs such as average order value, revenue per seat and customer satisfaction.
High turnover alone does not necessarily indicate stronger operational performance or profitability.
Revenue Per Labour Hour
Revenue per labour hour evaluates staffing productivity by comparing sales performance against labour hours worked. For operators looking to address overstaffing or understaffing and identify scheduling inefficiencies, it’s an absolutely critical metric. The formula is:
Revenue Per Labour Hour = Revenue / Total Labour Hours
Average Order Value (AOV)
Average order value measures the average amount customers spend per transaction. It’s commonly used by restaurant operators to assess customer spending behaviour, menu performance and the effectiveness of upselling strategies. The formula is:
Average Order Value = Total Revenue ÷ Number of Orders
Contribution Margin
Contribution margin measures how much profit individual menu items generate after direct costs have been deducted. Essential for menu engineering and pricing strategy, it allows operators to identify high-margin products and identify low-performing items.
Final Thoughts
Restaurant profit margins have never been particularly generous. And the challenges facing operators show little sign of easing. Rising labour costs, supplier volatility, delivery commissions and increasing overheads will likely continue to place pressure on profitability for the foreseeable future.
As a result, operational efficiency is becoming a genuine competitive advantage. Restaurants that closely monitor costs, inventory performance and customer spending behaviour are often better positioned to protect margins during difficult trading conditions.
The good news is that profitability rarely depends on a single transformational change. More often, it is the result of dozens of small improvements across pricing, menu design, labour management, procurement and waste reduction. Over time, these incremental gains can compound into significant financial results.
Ultimately, the restaurants that outperform their competitors are rarely those generating the most revenue. They are the ones that consistently convert revenue into sustainable profit through disciplined cost control, data-driven decision-making and operational excellence.
FAQ
What is a good restaurant profit margin?
Most restaurants operate with average net profit margins between 2% and 8%. This does, however, vary considerably according to restaurant type, location and operating model.
Why are restaurant profit margins so low?
Restaurants face high labour costs, rising food prices, occupancy expenses, utility bills and delivery commissions, all while operating in an extremely competitive industry.
Which restaurant type is most profitable?
Delivery-focused concepts, ghost kitchens and certain café models often achieve stronger margins due to lower labour and occupancy costs. However, profitability ultimately depends on operational efficiency and cost control.
How do delivery apps affect profit margins?
Third-party delivery platforms can increase order volume and customer reach. But commission fees often place considerable pressure on profitability, particularly for independent operators.
What percentage should labour cost be?
Labour costs typically account for around 25–35% of restaurant revenue, although this varies depending on restaurant type and service model.
What is prime cost in restaurants?
Prime cost combines labour costs and cost of goods sold (COGS), representing a restaurant’s two largest controllable expenses. Operators closely monitor prime cost because it provides insight into operational efficiency.
How can restaurants improve margins quickly?
Restaurants often improve margins by optimising menu pricing, reducing food waste, improving labour scheduling, increasing average spend per guest and simplifying operations.
How does AI improve restaurant profitability?
Modern restaurant management platforms help operators monitor sales, labour, inventory and customer behaviour in real time, enabling better forecasting, stronger cost control and improved operational efficiency.




.png?width=390&height=240&name=wheel-of-liverpool(1).png)