
 Dale Shelabarger

We kick off 2026 with the ninth edition of How Syrve Works. The chosen topic this month is our RFM Report feature - an increasingly important marketing tool that helps you identify your most valuable customers, predict future demand and create targeted campaigns that resonate with and engage diners.
What is RFM Analysis?
Put simply, RFM analysis is a customer segmentation method that evaluates customers based on the Recency, Frequency and Monetary value of their purchases. In practice, customers are organised into these segments based on how recently they made a purchase (Recency), how often (Frequency) and how much they spent (Monetary).
Why RFM Analysis is Important
RFM analysis is an effective way of converting raw transactional data into precise, actionable insights about customer value and behaviour that helps align rewards and messaging to customer behaviour. Instead of relying on broad assumptions, your marketing efforts become more informed, more relevant and far more targeted.
Here are the key benefits of using RFM reporting:
Identifies Your Most Valuable Customers - clearly highlights high-value, high-frequency, high-recency customers so you know where to focus your retention campaigns.
Improves Customer Retention - signposts lapsing customers, allowing you to intervene before they leave completely.
Improves Marketing Efficiency - reduces wasted marketing spend by helping you to target the segments most likely to engage and convert.
Enhances Customer Experience - helps align incentives, rewards and communications with customer behaviour, creating a more personalised experience.
Syrve integrates this methodology by embedding it directly into the platform, rather than treating it as a standalone analytical exercise. Here’s how it works.
Syrve’s RFM Report Tool
Syrve’s RFM Report is a built-in feature that’s available to Enterprise Plan users. As part of our loyalty module, it generates data directly from your points-of-sale across dine-in, delivery and takeaway channels.
Because it integrates directly with the wider platform, there’s no requirement to export order data or rely on spreadsheets. Everything is automatically updated in real time with new reports created every night.
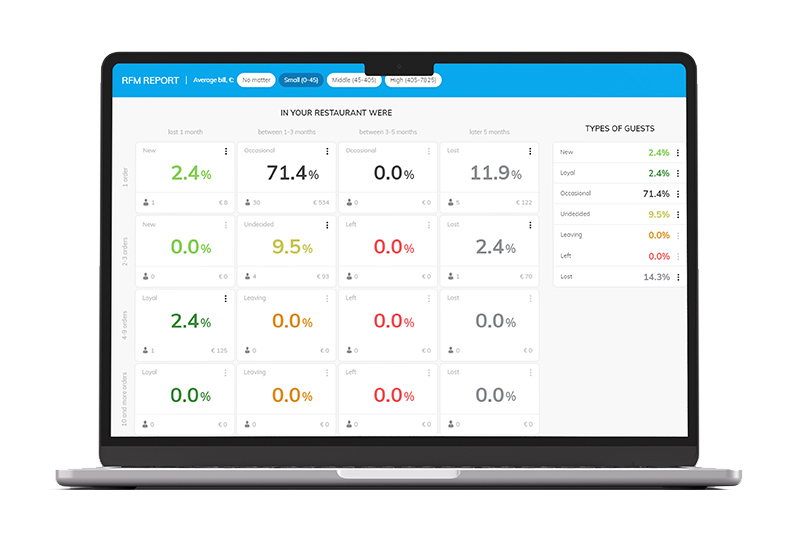
RFM Report Dashboard
The RFM Report dashboard, as depicted above, displays at-a-glance customer behaviour, according to recency and frequency, with spend context also layered in. With the use of colour-coded percentages, you can clearly see where customer value is concentrated and where the risk exists. This makes it much easier to prioritise retention and re-engagement strategies.
Below is a quick breakdown of the dashboard’s layout.
1. Top Row - Recency Groupings
The top row groups customers based on their last visit, making it easy to distinguish customers who remain engaged from those who are beginning to drift or have already been lost: Last 1 Month, 1 - 3 Months, 3 - 5 Months, Over 5 Months.
2. Side Column - Frequency Categories
To the left side of the dashboard are the frequency categories which distinguishes one-off, occasional customers from loyal or repeat diners: 1 Order, 2-3 Orders, 4-9 Orders, 10+ Orders
3. Segmented Group Tiles
Each group tile labels customers according to eight predefined guest segments: New, Loyal, Occasional, Undecided, Leaving, Left, Lost.
Within each of these tiles are percentages of total guests, the number of customers and the total revenue generated. As a result, you can see how many customers belong in each segment but also, precisely what they’re worth.
4. Type of Guests Side Panel
On the right is a side panel which summarises the RFM data tiles, providing a clear snapshot of your customer base.
5. Average Bill Feature
The Average Bill feature is central to Syrve’s RFM Report. Located in the blue bar above the data cells, it lets you segment your customers according to their typical spend per order. You can then view RFM behaviour for that particular spend band.
In essence, this filter allows you to isolate behaviour by customer value, revealing high and low-impact customers within the same segment, thus enabling far more precise retention and loyalty targeting.
The filter options are:
- No matter - includes all customers regardless of spend
- Small (0 - 45) - low average bill customers
- Middle (45 - 405) - mid-spend customers
- High (405 - 7825) - high-spend customers
Using the Data
Armed with such invaluable customer data, you can craft marketing campaigns that target each segment. To do so, head over to the Type of Guests Side Panel which contains the individual group segments.
Say for example, you want to target left or lapsed customers. The most effective way of re-engaging them is to send out compelling discounts, BOGO rewards and other such perks that pique their interest.
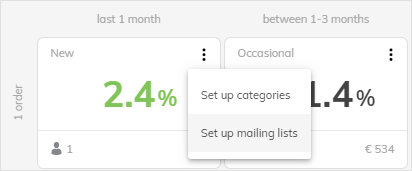
Create a Category and Mailing List
From here, create a category from within a corresponding 'left' tile and name it something like ‘Lapsed Customers’. You then add a corresponding incentive and create a themed ‘we miss you’ email template which specifically targets that group. Then head back to the Left group segment that you’re targeting and create a mailing list in the same drop-down menu as the 'categories' link.
 Assign Your Category and Send
With all going well, you’ll have successfully set up your ‘Lapsed Customers’ category, mailing list and email. It’s now just a case of assigning this to the leaving group via a drop-down menu (see above) along with your ‘we miss you’ newsletter.
Monitor the Results
After deployment, you can measure the campaign’s impact directly within Syrve by monitoring changes in the RFM Report. Key indicators to watch include:
- Customers moving from Left to Undecided or Occasional
- Increases in order activity from previously inactive customers
- Changes in average bill and frequency post-campaign
This closes the loop between insight and action, allowing you to see who was targeted, and whether the campaign successfully re-engaged customers.
Final Thoughts
Our RFM Report tool can provide you with a much clearer understanding of your customers’ behaviour. By moving beyond surface-level metrics, and instead focusing on recency, frequency and spend, you’ll be far better placed to make smarter, more informed marketing decisions. And the impact will be felt on multiple levels including your profit margins, customer experience and overall revenue stability.
To summarise then, RFM analysis can help you shift from reactive marketing to strategic, data-driven customer engagement. In such a competitive market, your future success, and potentially your long-term survival, may depend on it.


